

“Should we do a quick survey?”
“Did you see the results of that national survey?”
“How about we ask our families what their experiences are?”
These are questions that, as clinicians, we have all asked or discussed. Surveys are instruments that measure perceptions, beliefs, and attitudes1 and are powerful tools to understand experiences, performance, and even motivations. Yet, surveys often are also instruments that are misused and whose data are misinterpreted. The concept of a “validated survey” is one that is frequently quoted, uncommonly understood, and inaccurate.
I am not a Psychometrician, so why Should I Care about Psychometrics?
Although many of us may not ever develop a novel instrument, assessing the validity of data from a published tool is critical for interpreting and applying that data. In this article, we will discuss the concepts of statistical validity and reliability in instrument development. We will introduce the concept of psychometrics as a fundamental process for creating an instrument that provides data that are reproducible and measure what we intended. Having a basic understanding of psychometrics and the concepts of validity and reliability is critical for the interpretation of data collected through surveys, whether one is a researcher developing a new tool or a clinician deciding on how to use an existing one or understand results published in a journal.
A Word About the Term “Survey”
Colloquially, we often use the term “survey” to encompass a wide variety of meanings: a questionnaire, a needs assessment, the process of surveying (ie, “do a survey”), and more. Technically, however, the term “survey” refers not only to a set of written questions, but also both to the set of questions themselves and the process of collecting the questions. A way to conceptualize the differences is to consider that a questionnaire is an instrument for data collection and a survey is the method for collecting that data. Accordingly, in this paper, we are discussing the establishment of validity for the instrument itself, not the method of survey design. We will use the term “instrument” throughout when referring to the set of questions undergoing psychometric evaluation and “survey” when we are referring to the larger methodologic process of data collection.
What is Psychometrics?
Psychometrics is a discipline concerned with the development of instruments in which the intent is to connect observable data (eg, responses to items on a pediatric board examination) to theoretical concepts (eg, pediatric medical knowledge).2,3 Accordingly, psychometric measurement is the process of assigning values to represent behaviors or attributes. Dating back to Francis Galton’s 1879 essay entitled “Psychometric Experiments,” psychometrics is the “art of imposing measurement and number upon the operations of the mind.”4 Ultimately, it helps to answer the questions, “Does a test measure what it is supposed to measure?” and “Can we trust the scores?” through a statistical evaluative process.
This evaluative process is critical because data are the centerpiece of empirical research. Data result from measurement, and for data to be useful, the measurements need to be valid. The validity of a measurement reflects how accurately something measures what it intends to measure. Accordingly, the more valid the measurement, the better the data, the better the conclusions resulting from the data.
Psychometric validation is a statistically intensive process in which even basic terms and concepts can feel abstract if not applied to an example. Through the remainder of this paper, we will use the Pediatric Integrated Care Survey (PICS)5 to illustrate this process and guide the reader through the different analyses and decisions. The PICS is a 19-item instrument developed to measure a caregiver’s experience of care for their child across institutions, providers, and settings, yielding a measurement of integration of care.
Starting With Constructs
All instruments are measuring at least 1 construct. A construct is the idea, concept, or subject matter an instrument is measuring (eg, integrated care, physician wellness, parent satisfaction). During the construction of an instrument, questions (items) are developed to measure behaviors, attitudes, or opinions of the respondent related to an overarching construct. These items are how the researcher transforms a participant’s response into data. Within instruments that undergo psychometric validation, these items are usually closed ended (eg, multiple choice, true/false, or categorical response options).
Frequently within a given instrument, although there is 1 overarching guiding construct, items can represent many subconstructs (Fig 1). These underlying subconstructs, however, may not always be known at the beginning of instrument creation and are revealed using statistical analyses such as Exploratory Factor Analysis (EFA). For example, the overarching construct for PICS was a caregiver’s experience of integrated care. However, the EFA revealed that the final PICS instrument included 5 subconstructs that measure different and contributory aspects of the overarching construct of pediatric integrated care (Fig 1): access, communication, family impact, care goal creation, and team functioning.
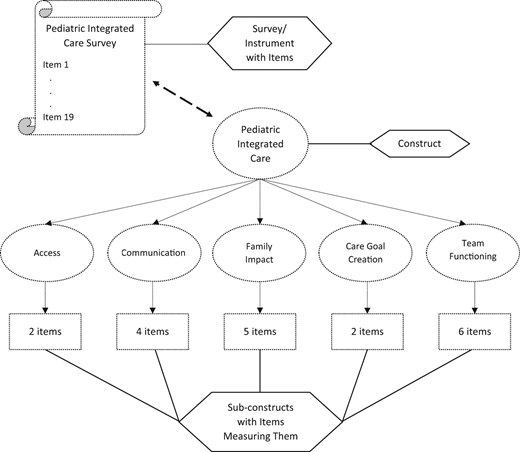
Constructs and subconstructs: an example of internal structure using the Pediatric Integrated Care Survey.
Constructs and subconstructs: an example of internal structure using the Pediatric Integrated Care Survey.
Different Types of Validity, Reliability, and How to Measure Them
Psychometric validation relies on 2 primary areas of analyses: reliability and validity. An instrument is not itself inherently valid or reliable, nor can it be “validated.”6,7 Validity and reliability are properties of the data, or the scores that we calculate based on the data, rather than the instrument itself. Consequently, the data resulting from administration or use of an instrument can have varying degrees of validity and reliability evidence in different contexts (Table 1). For example, Medical College Admissions Test scores are designed to predict medical student performance throughout undergraduate medical education.8 So, although a 78-year-old nephrologist may sit to take the test, the results are not predictive of what kind of nephrologist she may be after 50 years of practice. Validity evidence is person, time, indication, and context specific.
Different Measures of Validity and Reliability
| Type | Definition | Statistical Measures and Their General Interpretation of Minimum Levels of Acceptability | |
|---|---|---|---|
| Reliability | |||
| Internal consistency | Items that are measuring the same construct should have correlated results | Omega | >0.7 is acceptable, >0.8 is excellent, >0.9 suggests item redundancya |
| Cronbach α | |||
| Split-half reliability | |||
| Test-tetest | Survey items have temporal stability | Correlation coefficients dependent upon type of datab: | |
| Pearson r for continuous variables | |0.3|-|0.49| is weak correlation | ||
| |0.5|- |0.69| is moderate | |||
| |0.7| - |0.89| is strong | |||
| Spearman ρ for ordinal variables | |0.9| - |1| is very strong | ||
| Tetrachoric correlation coefficient for dichotomous variables | Note: Positive values indicate positive correlation, whereas negative values indicate negative correlation | ||
| Validity | |||
| Construct | |||
| Exploratory factor analysis | Statistical technique to reduce data into theoretical “factors” of the construct of interest | Number of factors to be determined byc,d: | |
| Kaiser-Guttman rule | Number of factors is equal to the number of factors with eigenvalues >1.0 | ||
| Scree plot | “Elbow” of the graph where eigenvalues level off is the point of significant factors | ||
| Parallel analysis | Retain the number of factors where eigenvalues of the sample data are higher than those from simulated data | ||
| Confirmatory factor analysis | Statistical technique to confirm if data fit hypothesized factor structure | Model fit usinge: | |
| Root mean squared error of approximation | <0.06 excellent | ||
| Comparative fit index | >0.90 acceptable, >0.95 excellent | ||
| Tucker-Lewis index | >0.90 acceptable, >0.95 excellent | ||
| Goodness of fit indices | >0.95 acceptable | ||
| Standardized root mean squared residual | <0.8 acceptable fit | ||
| Convergent | Ability to strongly positively or negatively correlate with other instruments that measure similar constructs | Correlation coefficients dependent upon type of datab: | |
| Pearson r for continuous variables | |0.3|-|0.49| is weak correlation | ||
| |0.5|- |0.69| is moderate | |||
| Divergent | Ability to not correlate with other instruments that measure not-similar constructs | Spearman ρ for ordinal variables | |0.7| - |0.89| is strong |
| |0.9| - |1| is very strong | |||
| Tetrachoric correlation coefficient for dichotomous variables | Note: Positive values indicate positive correlation, whereas negative values indicate negative correlation | ||
| Criterion | |||
| Concurrent | Ability of an instrument to predict current outcomes | Correlation coefficients dependent upon type of datab: | |
| Pearson r for continuous variables | |0.3|-|0.49| is weak correlation | ||
| |0.5|- |0.69| is moderate | |||
| Predictive | Ability of an instrument to predict future outcomes | Spearman ρ for ordinal variables | |0.7| - |0.89| is strong |
| |0.9| - |1| is very strong | |||
| Tetrachoric correlation coefficient for dichotomous variables | Note: Positive values indicate positive correlation, whereas negative values indicate negative correlation | ||
| Known group and divergent | Comparing known groups on survey outcomes to detect hypothesized differences | t tests, analyses of variance, regression models, etc. | |
Tavakol M, Dennick R. Making sense of Cronbach’s α. Int J Med Educ. 2011;2:53–55.
Schober P, Boer C, Schwarte LA. Correlation coefficients: appropriate use and interpretation. Anesth Analg. 2018;126(5):1763–1768.
Kline TJB. Psychological Testing: A Practical Approach to Design and Evaluation. Sage Publications; 2005.
Watkins MW. Exploratory factor analysis: a guide to best practice. J Black Psychol. 2018;44(3):219–246.
Brown TA. Confirmatory factor analysis for applied research. The Guilford Press; 2006.
In the psychometric assessment of an instrument, after having established the number of subconstructs, we analyze the data for reliability and validity. Generating reliability evidence further elucidates the underlying structure that the instrument is measuring. Then, generating validity evidence assesses how well the measures of the instrument and associated assumptions reflect the underlying construct and subconstructs. Because validity and reliability are properties of the data, the process of establishing them is dynamic and ongoing with the use of an instrument in any new context or population.
Reliability, as defined by Classic Test Theory, is how precise and consistent a given measurement and score is from a test or instrument. Classic Test Theory postulates that a respondent’s observed score on any administered test is a combination of their “true” score and some measurement error. The greater the measurement error, however, the less reflective an observed score is of an individual’s true score and the less reliable the scores are this instrument would produce. There are 2 primary types of reliability: internal consistency and test-retest reliability.
Internal consistency is the more important type of reliability and examines for each subconstruct if the items measure what they are intended to measure. This implies that on a theoretical level the items that measure the same subconstruct are interchangeable. In addition, this analysis offers the opportunity to identify redundant items that either do not measure a subconstruct in the same way as the other items or do not provide any additional information beyond the items already assigned to the subconstruct.
For example, in PICS, the subconstruct “care goal creation” originally included 1 additional item asking if the care team had asked the family about specific care goals. When internal consistency was calculated for the subconstruct, this item did not calculate to measure the same subconstruct as the other 2 items in that category. This item was dropped, and subsequently favorably increased Cronbach α, a measure of internal consistency, from 0.46 to 0.64 for the subconstruct.
Test-retest reliability assesses the stability of responses over time and requires the administration of the instrument to the same participants on 2 occasions separated by time. Not only is this type of reliability the most resource intensive, but its assumption that the first administration of the instrument does not influence the second measurement is questionable in a setting where human memory comes into play. For PICS, 59% of 442 participants who agreed to participate in the study were assigned to receive the instrument a second time 2 weeks after they completed the first instrument. Of the 19 items in the final instrument, all demonstrated moderate to substantial consistency over time.
Validity, on the other hand, is the interpretability and accuracy of measurements and outcomes. Although we will not be discussing the nuances between various theories of validity (ie, Messick versus Kane9–11 validity) within psychometrics confirms the underlying theory and structure of a construct measured by a developed instrument.
Content and response process validity are processes that focus on the wording and the content of the items to ensure the items themselves are capturing the overarching construct and its subconstructs.7 This often may include review from psychometric and content experts, use of Delphi and modified Delphi panels, and cognitive pretesting of items. For PICS, an expert advisory panel of 17 panelists provided feedback on the content of the instrument, and 8 cognitive interviews were conducted to assure that respondents understood questions in the way they were intended.
Other types of validity rely completely on statistical assessments. First, construct validity is concerned with the relationships between the scores representing different variables and constructs within an instrument or its internal structure. The investigation into the underlying, or latent, structure of a set of items through an EFA is a first step in providing evidence for construct validity, as mentioned before.
Once constructs and subconstructs have been established, the next aspect of construct validity is to assess if the relationships between scores reflect our assumptions of the relationships between the items, constructs, and subconstructs of an instrument. Some constructs might be expected to be strongly related, positively or negatively. For PICS, it was hypothesized that efficient team functioning would impact all other subconstructs and therefore be strongly related, demonstrating evidence of convergent (construct) validity. It also was hypothesized that care goal creation would show the weakest correlations with the other subconstructs, evidence of divergent (construct) validity. Indeed, team functioning showed correlations between 0.43 and 0.60 with access, communication, and family impact (moderate strength), whereas the correlations of care goal creation with the other 4 subconstructs ranged between 0.09 and 0.27 (weak correlation).
Another way to assess construct validity is to show that scores from a subconstruct can discriminate between groups that can be defined through demographics, health care usage, or other characteristics (discriminative/known-group or extreme group validity). For PICS, it was hypothesized that children with characteristics that indicated increased health care needs and usage are more likely to experience fragmented care and should therefore show lower scores on the subconstructs. What we found is that for children with mental health care needs was that they had significantly lower scores on all 5 subconstructs, meaning that they experienced worse access to care, worse communication, their interactions with the health care system had more impact on their family, they had less care goal creation, and less efficient functioning of their health care team.
Last, confirmatory factor analysis is used to corroborate the internal structure of the instrument with the theoretical subconstructs. This statistical analysis must be performed on data that were collected by administering the instrument to different respondents from the same or a similar population as the initial EFA.
Criterion validity assesses how certain items or constructs relate to other variables, criteria, or standards, outside an instrument, ideally based on hypotheses. When these criteria are measured roughly at the same time as an instrument, this is concurrent (criterion) validity. If they are measured after the administration of an instrument, it is predictive (criterion) validity. A criterion is generally defined as a “gold standard” in measuring a given construct or subconstruct. Concurrent validity was assessed in PICS through concurrent administration of the Consumer Assessment of Healthcare Providers and Systems Clinician and Group Survey that asks about experiences with providers and staff in primary care and specialty care settings.12 For example, the subconstruct “access” on PICS correlates with Child Consumer Assessment of Healthcare Providers and Systems items asking about the ease of getting therapy, counseling, and appointments.
Providing evidence for these different types of validity and reliability requires careful planning and preparation so that other measures to serve as criteria can be either administered or gathered at the same time to establish concurrent validity or in the future and linked back to each participant (predictive validity); variables identifying different groups are carefully measured so known-group validity can be established; or the instrument can be administered a second time to assess test-retest reliability.
So, What is the “Bare Minimum”?
Similar to the adage, “If you’ve seen 1 hospital medicine program, you’ve seen 1 program,” the establishment of validity evidence for an instrument is context and population specific. There is no minimum standard of acceptability for an instrument’s use or evaluation, so the burden of evaluation falls on the researcher developing the instrument and the individual who may be assessing a potential application of the instrument. When developing a new instrument, early involvement of a psychometrician can assist with methodology and assessment. When evaluating if a published instrument can be used in a new context or a new population, additional testing to verify the reliability and validity of the data within the new context may also be necessary. However, in the application of any developed instrument there are varying thresholds for methodologic rigor, and the use of an instrument to inform local quality improvement efforts will require differing levels of validity evidence than the use of an instrument within a randomized control trial.
Key Take Aways
A questionnaire or survey instrument is not itself valid. It is the data that have varying degrees of validity evidence.
Most instruments will not have all aspects of established reliability or validity data6 ; as such, knowing which components are present helps to interpret the potential error and bias in an instrument’s reported outcomes or measurements.
Validity evidence is restricted to the context and population in which the validation was performed. Establishing reliability and validity contextualizes the generalizability and applicability of resulting data from use of the instrument. When assessing if a published instrument could be extrapolated and used in a separate context from the original survey it was used for, knowing the reliability and validity of the data informs what additional testing needs to be performed before administration of the instrument within a new context.
Want to Learn More?
Cook DA, Beckman TJ. Current concepts in validity and reliability for psychometric instruments: theory and application. Am J Med. 2006;119(2):166 e167–e116.
Kline TJB. Psychological Testing: A Practical Approach to Design and Evaluation. Thousand Oaks, CA: Sage Publications; 2005.
Streiner DL, Norman GR. Health Measurement Scales: A Practical Guide to Their Development and Use. New York: Oxford University Press; 2008.
FUNDING: No external funding.
CONFLICT OF INTEREST DISCLOSURES: The authors have indicated they have no potential conflicts of interest to disclose.
Drs McDaniel and Ziniel drafted, revised, and approved the final manuscript.


Comments